Command-line reference
In addition to gimme motifs the GimmeMotifs package contains
several other tools that can perform the various substeps of
GimmeMotifs, as well as other useful tools. Run them to see the options.
List of tools
Input formats
Most tools in this section take a file in PFM format as input. This is actually a file with Position Specific Scoring Matrices (PSSMs) containing frequencies. It looks like this:
>motif1
0.3611  0.0769  0.4003  0.1664
0.2716  0.0283  0.5667  0.1381
0.6358  0.0016  0.3344  0.0330
0.0016  0.9859  0.0016  0.0157
0.8085  0.0063  0.0502  0.1397
>motif2
0.2276  0.0157  0.0330  0.7284
0.0031  0.0016  0.9984  0.0016
0.0377  0.3799  0.0016  0.5856
0.0816  0.7096  0.0173  0.1962
0.1350  0.4035  0.0675  0.3987
The frequencies are separated by tabs, and in the order A,C,G,T.
Command: gimme motifs
The gimme motifs command can be used for known and/or de novo motif analysis.
By default it runs both.
Quick example of de novo motif analysis
You can try GimmeMotifs with a small example dataset included in the examples directory, included with GimmeMotifs. This example does not require any additional configuration if GimmeMotifs is installed correctly.
Change to a directory where you have write permissions and run the following command (substitute the filename with the location of the file on your system):
gimme motifs /usr/share/gimmemotifs/examples/TAp73alpha.fa p73 --denovo -g hg19
The first argument is the name of the input file and the second argument
defines the name of the output directory that is created. All output files
are stored in this directory. The genome is set to the hg38 genome. This
requires you to have installed hg38 using genomepy. Alternatively, you
can also supply the path to a genome FASTA file with the -g option.
Depending on your computer, this analysis will take around 15-20 minutes. By default, the three top-performing de novo motif tools will be used: MEME, Homer and BioProspector. Once GimmeMotifs is finished you can open p73/p73_motif_report.html in your browser.
You can also run the same analysis with a BED file or narrowPeak file as input, or a text
file with regions in chrom:start-end format
Best practices and tips
GimmeMotifs is multi-threaded
GimmeMotifs runs multi-threaded and by default uses 12 threads. All the
de novo programs will be run in parallel as much as possible. Of
course some programs are still single-threaded, and will not really
benefit from multithreading. You can change the number of threads that
are used using the -N parameter.
Running time
The running time of the de novo part of GimmeMotifs largely depends on three factors:
the size of the input dataset;
the motif prediction tools you use;
the size of the motifs to be identified.
Size of input dataset
While GimmeMotifs is developed specifically for ChIP-seq datasets, most
motif prediction tools are not. In practice this means that it does not
make much sense to predict motifs on a large amount of sequences, as
this will usually not result in higher quality motifs. Therefore
GimmeMotifs uses an absolute limit for the prediction set. By default
20% of the sequences are used as input for motif prediction, but with an
absolute maximum. This is controlled by the abs_max parameter in the
configuration file, which is set to 1000 by default. In general, if you
have a large amount of peaks, you can also consider to run GimmeMotifs
on the top sequences of your input, for instance the 5000 highest peaks.
Motif prediction tools
By default, gimme motifs uses three de novo motif prediction tools:
MEME, BioProspector and Homer. These we found to be the best performing
programs for ChIP-seq data (Bruse & van Heeringen, 2018).
You can include a large variety of other tools by using the -t
parameter. This will result in an increased running time and some tools,
such as GADEM, will take a very long time.
The following tools are supported:
With the exception of RPMCMC and YAMDA, all tools come installed with GimmeMotifs when using the bioconda package. AMD, HMS, Improbizer, MotifSampler and DiNAMO are not supported on OSX.
Please note: all these programs include their own license and many are free for academic or non-commercial use only. For commercial use of any of these programs, please consult the respective author! GimmeMotifs itself can be freely used commercially.
Motif size
The default setting for motif size is -a xl, which searches for motifs
with a length of up to 20. You can use different analysis sizes:
small (up to 8), medium (up to 10) or large (up to 14). The
running time can be significantly shorter for shorter motifs. However,
keep in mind that the xl analysis setting results in the best motifs
in general.
Small input sets
GimmeMotifs is developed for larger datasets, such as ChIP-seq peaks, where
you have the luxury to use a large fraction of your input for
validation. This means that at least several hundred sequences would be optimal. If
you want to run GimmeMotifs on a small input dataset, it might be
worthwile to increase the fraction used for motif prediction with the -f
argument, for instance -f 0.5.
Running on FASTA files
It is possible to run GimmeMotifs on a FASTA file as input instead of a BED file. This is detected automatically if your inputfile is correctly formatted according to FASTA specifications. Please note that for best results, all the sequences should be of the same length. This is not necessary for motif prediction, but the statistics and positional preference plots will be wrong if sequences have different lengths.
Intermediate results
GimmeMotifs produces a lot of intermediate results, such as all
predicted motifs, FASTA files used for validation and so on. These are
deleted by default (as they can get quite large), but if you are
interested in them, you can specify the -k option.
Detailed options for gimme motifs
Positional arguments
INPUTThe inputfile needs to be in BED, FASTA, narrowPeak or region format. By default
gimme motifswill take the center of these features, and extend those to the size specified by the-sor--sizeargument. By default this is 200 bp. Keep in mind that the smaller the regions are, the better motif discovery will work. BED-fomatted files need to contain at least three tab-separated columns describing chromosome name, start and end. The fourth column is optional. If it is specified it will be used by some motif prediction tools to sort the features before motif prediction. FASTA files can be used as input for motif prediction. For best results it is recommended to use sequences of the same size. Peak files in narrowPeak format, such as produced by MACS2, can also directly be used as input. With these files,gimme motifswill use the summit of the peak and create regions of size 200 centered at this summit. Use the-sparameter to change this size. Finally, region files can be used. These contain one column, with regions specified inchrom:start-endformat.OUTDIRThe name of the output directory. All output files will be saved in this directory. If the directory already exists files will be overwritten.
Optional arguments
-b BACKGROUND,--background BACKGROUNDType of background to use. There are five options:
gc,genomic,random,promoteror the path to file with background sequences (FASTA, BED or regions). By defaultgcis used, which generates random regions from the genome with a similar GC% as your input sequences. Thegenomicbackground will select random genomic regions without taking the sequence composition into account. Therandombackground will create artificial sequences with a similar nucleotide distribution as your input sequences. Thepromoterbackground will select random promoters. For this option, your genome needs to be installed with genomepy using the--annotationoption. Finally, you can select your own custom background by supplying the path to a file.-g GENOMEName of the genome to use. This can be the name of a genome installed with genomepy or the path to a FASTA file.
--denovoOnly run de novo motif analysis. By default, the analysis includes known motifs. For specific arguments for de novo motif analysis, see below.
--knownOnly run known motif analysis. By default, the analysis includes de novo motifs. For specific arguments for known motif analysis, see below.
--noreportDon’t create a HTML report, only plain text output files.
--rawscoreDon’t use z-score normalization for motif scores. The raw logodds motif score are dependent on motif length. This means that the same logodds score will mean different things for motifs with a different length. By default, GimmeMotifs uses the scores in a set of genomic background regions to determine the a background distribution of scores. The logodds score is then scaled using this distribution.
--nogcBy default GimmeMotifs calculates the motif logodds score distribution for regions with a different GC%. The score is then normalized according to the GC% bin per input sequence. Use this argument to turn this off.
-N INT,--threads INTNumber of threads to use (default is 12).
Optional arguments for known motif analysis
-p PFMFILEPFM file with motifs to use for known motif analysis. You can use a custom PFM file, or use any of the databases included with GimmeMotifs such as, for instance,
JASPAR2020_vertebrates,HOMER,HOCOCOMOv11_HUMANorCIS-BP. By default, a database of clustered vertebrate motifs is used,gimme.vertebrate.v5.0. This database has a limited motif redundancy.
Optional arguments for de novo motif analysis
-t TOOLS,--tools TOOLSThe de novo motif prediction tools to use, separated by commas. This can be any combination of the following: AMD, BioProspector, ChIPMunk, DiNAMO, GADEM, DREME, HMS, Homer, Improbizer, MDmodule, MEME, MEMEW, MotifSampler, POSMO, ProSampler, RPMCMC, Trawler, Weeder, XXmotif, YAMDA. By default
TOOLSisBioProspector,Homer,MEME. Note that some tools may not be installed. Runninggimme motifs -hwill always list the tools that are supported on your installation of GimmeMotifs.-a,--analysisThe size of motifs to look for: small (5-8), medium (5-12), large (6-15) or xl (6-20). The larger the motifs, the longer the de novo motif prediction will take. By default, xl will be used as this generally yields the best motifs. However, some prediction tools take a very long time in combination with the xl setting.
k,--keepintermediateKeep intermediate files.
-s,-–singlestrandOnly use the forward strand for prediction. By default both strands are used.
-f FRACTION,--fraction FRACTIONThis parameter controls the fraction of the sequences used for prediction. This 0.2 by default, so in this case a randomly chosen 20% of the sequences will be used for prediction. The remaining sequences will be used for validation (enrichment, ROC curves etc.). If you have a large set of sequences (ie. most ChIP-seq peak sets), this is fine. However, if your set is smaller, it might be worthwile to increase this prediction fraction. The number of sequences that is used is also influenced by the
abs_maxparameter in the configuration file. Regardless of the-fparameter, the total number of sequences used for motif prediction will never exceed the number specified byabs_max.-s N,--size NThis is the size of the sequences used for motif prediction. Smaller sequences will result in a faster analysis, but you are of course limited by the accuracy of your data. For the tested ChIP-seq data sets 200 performs fine. If this parameter is set to
0, the original size of the regions in the input file will be used.
Command: gimme maelstrom
This command can be used to identify differential motifs between two or more data sets. See the maelstrom tutorial for more details.
Positional arguments:
INPUTFILE             file with regions and clusters
GENOME                genome
DIR                   output directory
Optional arguments:
-h, --help            show this help message and exit
-p pfmfile, --pfmfile pfmfile
                      PFM file with motifs (default:
                      gimme.vertebrate.v5.0.pfm)
--no-filter           Don't remove redundant motifs.
-F FLOAT, --filter_cutoff FLOAT
                      Cutoff to select non-redundant motifs. Default is 0.8,
                      increase this value to get fewer motifs.
--nocenter            Don't mean-center the rows by default
-m NAMES, --methods NAMES
                      Run with specific methods
-a method, --aggregation method
                      How to combine motifs from individual methods. Default
                      is "int_stouffer", for inverse normal transform of
                      ranks, followed by Stouffer's method to combine
                      z-scores. Alternatively, specify "stuart" for log-
                      transformed rank aggregation p-values.
-N INT, --nthreads INT
                      Number of threads (default 12)
--rawscore            Don't z-score normalize motif scores
--nogc                Don't use GC% bins
Input file formats
The input can be in one of two possible formats.
In both cases the genomic location should be present as chrom:start-end in the first column.
The first option is a two-column format and looks like this:
loc    cluster
chr15:49258903-49259103    NK
chr10:72370313-72370513    NK
chr4:40579259-40579459    Monocytes
chr10:82225678-82225878    T-cells
chr5:134237941-134238141    B-cells
chr5:58858731-58858931    B-cells
chr20:24941608-24941808    NK
chr5:124203116-124203316    NK
chr17:40094476-40094676    Erythroblast
chr17:28659327-28659527    T-cells
This can be the result of a clustering analysis, for instance.
The second option looks like this:
loc    NK    Monocytes    T-cells    B-cells
chr12:93507547-93507747    3.118    2.522    1.933    0.197
chr7:38236460-38236660    1.098    0.502    0.201    0.190
chr10:21357147-21357347    0.528    -0.066    -1.04    -0.343
chr6:115521512-115521712    0.406    -0.376    -0.480    -0.667
chr2:97359808-97360008    1.501    0.905    0.719    0.031
chr16:16684549-16684749    0.233    -0.362    -0.837    -0.746
chrX:138964544-138964744    0.330    -0.291    -0.686    -0.777
chr2:186923973-186924173    0.430    -0.258    -1.164    -0.723
chrX:113834470-113834670    0.560    -0.036    -0.686    -0.692
This is a tab-separated table, with a header describing the experiments.
In case of sequencing data, such as ChIP-seq, ATAC-seq or DNaseI seq,
we recommend to use log-transformed read counts which are mean-centered per row.
For optimal results, it is recommended to normalize between experiments (columns) after the log-transformatiion step,
for instance by quantile normalization or scaling.
By default, gimme maelstrom will mean-center the input, disable this with --nocenter.
The second input format generally gives better results than the first one and would be the recommended format.
The output scores of gimme maelstrom represent the combined result of multiple methods.
This z-score represents the combined result of multiple methods.
The individual results from different methods are ranked from high-scoring motif to low-scoring motif and converted
to z-scores using the inverse normal transformation. The z-scores from individual methods are then combined using
Stouffer’s method. The score that is shown is the aggregated z-score. A higher z-score means that presence of
the motif or a higher motif score is associated with higher signal in a specific sample.
By default, gimme maelstrom selects a non-redundant set of motifs by clustering the motifs based on scores in the set of
input sequences. You can disable this by using the --no-filter argument. You can tweak the number of selected motifs by
changing the --filter-cutoff parameter. By default this is set to 0.8. Increase this value to select fewer motifs,
decrease it to select more motifs. Keep in mind that you may start to lose biologically relevant motifs if you set this too high.
Command: gimme scan
Scan a set of sequences with a set of motifs, and get the resulting
matches in GFF, BED or table format.
If the FASTA header includes a chromosome location in chrom:start-end format, the BED output will return the genomic location of the motif match.
The GFF file will always have the motif location relative to the input sequence.
A basic command would look like this:
$ gimme scan peaks.bed -g hg38 -b > motifs.bed
The threshold that is used for scanning can be specified in a number of ways.
The default threshold is set to a motif-specific 1% FPR by scanning random genomic sequences.
You can change the FPR with the -f option and/or the set of sequences that is used to determine the FPR with the -B option.
For instance, this command would scan with thresholds based on 5% FPR with random genomic mouse sequences.
$ gimme scan input.fa -g mm10 -f 0.05 -b > gimme.scan.bed
And this command would base a 10% FPR on the input file hg38.promoters.fa:
$ gimme scan input.fa -f 0.1 -B hg38.promoters.fa -b > gimme.scan.bed
Alternatively, you can specify the threshold as a single score. This score is relative and is based on the maximum and minimum possible score for each motif. For example, a score of 0.95 means that the score of a motif should be at least 95% of the (maximum score - minimum score). This should probably not be set much lower than 0.8, and should be generally at least 0.9-0.95 for good specificity. Generally, as the optimal threshold might be different for each motif, the use of the FPR-based threshold is preferred. One reason to use a single score as threshold is when you want a match for each motif, regardless of the score. This command would give one match for every motif for every sequence, regardless of the score.
$ gimme scan input.bed -g hg38 -c 0 -n 1 -b > matches.bed
Finally, gimme scan can return the scanning results in table format.
The -t will yield a table with number of matches, while the -T will have the score of the best match.
Positional arguments:
INPUTThe inputfile needs to be in BED, FASTA or region format. BED-fomatted files need to contain at least three tab-separated columns describing chromosome name, start and end. Region files can also be used. These contain one column, with regions specified in
chrom:start-endformat.
Optional arguments
-g GENOMEName of the genome to use. This can be the name of a genome installed with genomepy or the path to a FASTA file.
-p PFMFILE,--pfmfile PFMFILEPFM file with motifs to use for known motif analysis. You can use a custom PFM file, or use any of the databases included with GimmeMotifs such as, for instance,
JASPAR2020_vertebrates,HOMER,HOCOCOMOv11_HUMANorCIS-BP. By default, a database of clustered vertebrate motifs is used,gimme.vertebrate.v5.0. This database has a limited motif redundancy.-f,--fprBase the motif score threshold on this FPR. By default this is set to 1%, equivalent to
-f 0.01. The score threshold is based on scanning random genomic regions with the same size and the same GC% distribution. This threshold is calculated once for a specific sequence size and cached. Therefore, scanning will take longer the first time you use a specific FPR with a specific input sequence size.-B,--bgfileSpecify a FASTA file to use for FPR calculation, instead of taking random genomic regions.
-c,--cutoffUse this score cutoff instead of an FPR-based threshold. This score is relative and is based on the maximum and minimum possible score for each motif. For example, a score of 0.95 means that the score of a motif should be at least 95% of the (maximum score - minimum score). This should probably not be set much lower than 0.8, and should be generally at least 0.9-0.95 for good specificity. Generally, as the optimal threshold might be different for each motif, the use of the FPR-based threshold is preferred.
-n,--nreportMaximum number of matches to report per motif per sequence. By default this is set to 1.
-r,--norcDon’t scan the reverse complement of the sequence. By default both strands will be scanned.
-b,--bedOutput motif matches in BED format.
-t,--tableOuput number of matches in a table format, where columns represent motifs and rows represent input sequences.
-T,--score_tableOuput maximum motif score in a table format, where columns represent motifs and rows represent input sequences. The score will be reported for each motif, regardless if it is a good match or not.
-z,--zscoreUse z-score normalization for motif scores. The raw logodds motif score are dependent on motif length. This means that the same logodds score will mean different things for motifs with a different length. By default, GimmeMotifs uses the scores in a set of genomic background regions to determine the a background distribution of scores. The logodds score is then scaled using this distribution.
--gcUse this option to calculate the motif logodds score distribution based on regions with a similar GC%.
-N INT, --threads INTNumber of threads to use (default is 12).
Command: gimme background
Generate random sequences according to one of several methods:
random- randomly generated sequence with the same dinucleotide distribution as the input sequences according to a 1st order Markov modelgenomic- sequences randomly chosen from the genomegc- sequences randomly chosen from the genome with the same GC% as the input sequencespromoter- random promoter sequences
The background types gc and random need a set of input sequences
in BED or FASTA format. If the input sequences are in BED format, the
genome version needs to be specified with -g.
Positional arguments:
FILE        outputfile
TYPE        type of background sequences to generate
            (random,genomic,gc,promoter)
Optional arguments:
-h, --help  show this help message and exit
-i FILE     input sequences (BED or FASTA)
-f TYPE     output format (BED or FASTA
-l INT      length of random sequences
-n NUMBER   number of sequence to generate
-g GENOME   genome version (not for type 'random')
-m N        order of the Markov model (only for type 'random', default 1)
Command: gimme logo
Convert one or more motifs in a PFM file to a sequence logo. Most of these logos are made possible by the excellent Logomaker package.
You can optionally supply a PFM file, otherwise gimme logo uses the default gimme.vertebrate.v5.0.
With the -i option, you can choose one or more motifs to convert.
This will convert all the motifs in CTCF.pfm to a sequence logo:
$ gimme logo -p CTCF.pfm
This will create a logo for GM.5.0.Ets.0026 from the default database.
$ gimme logo -i GM.5.0.Ets.0026
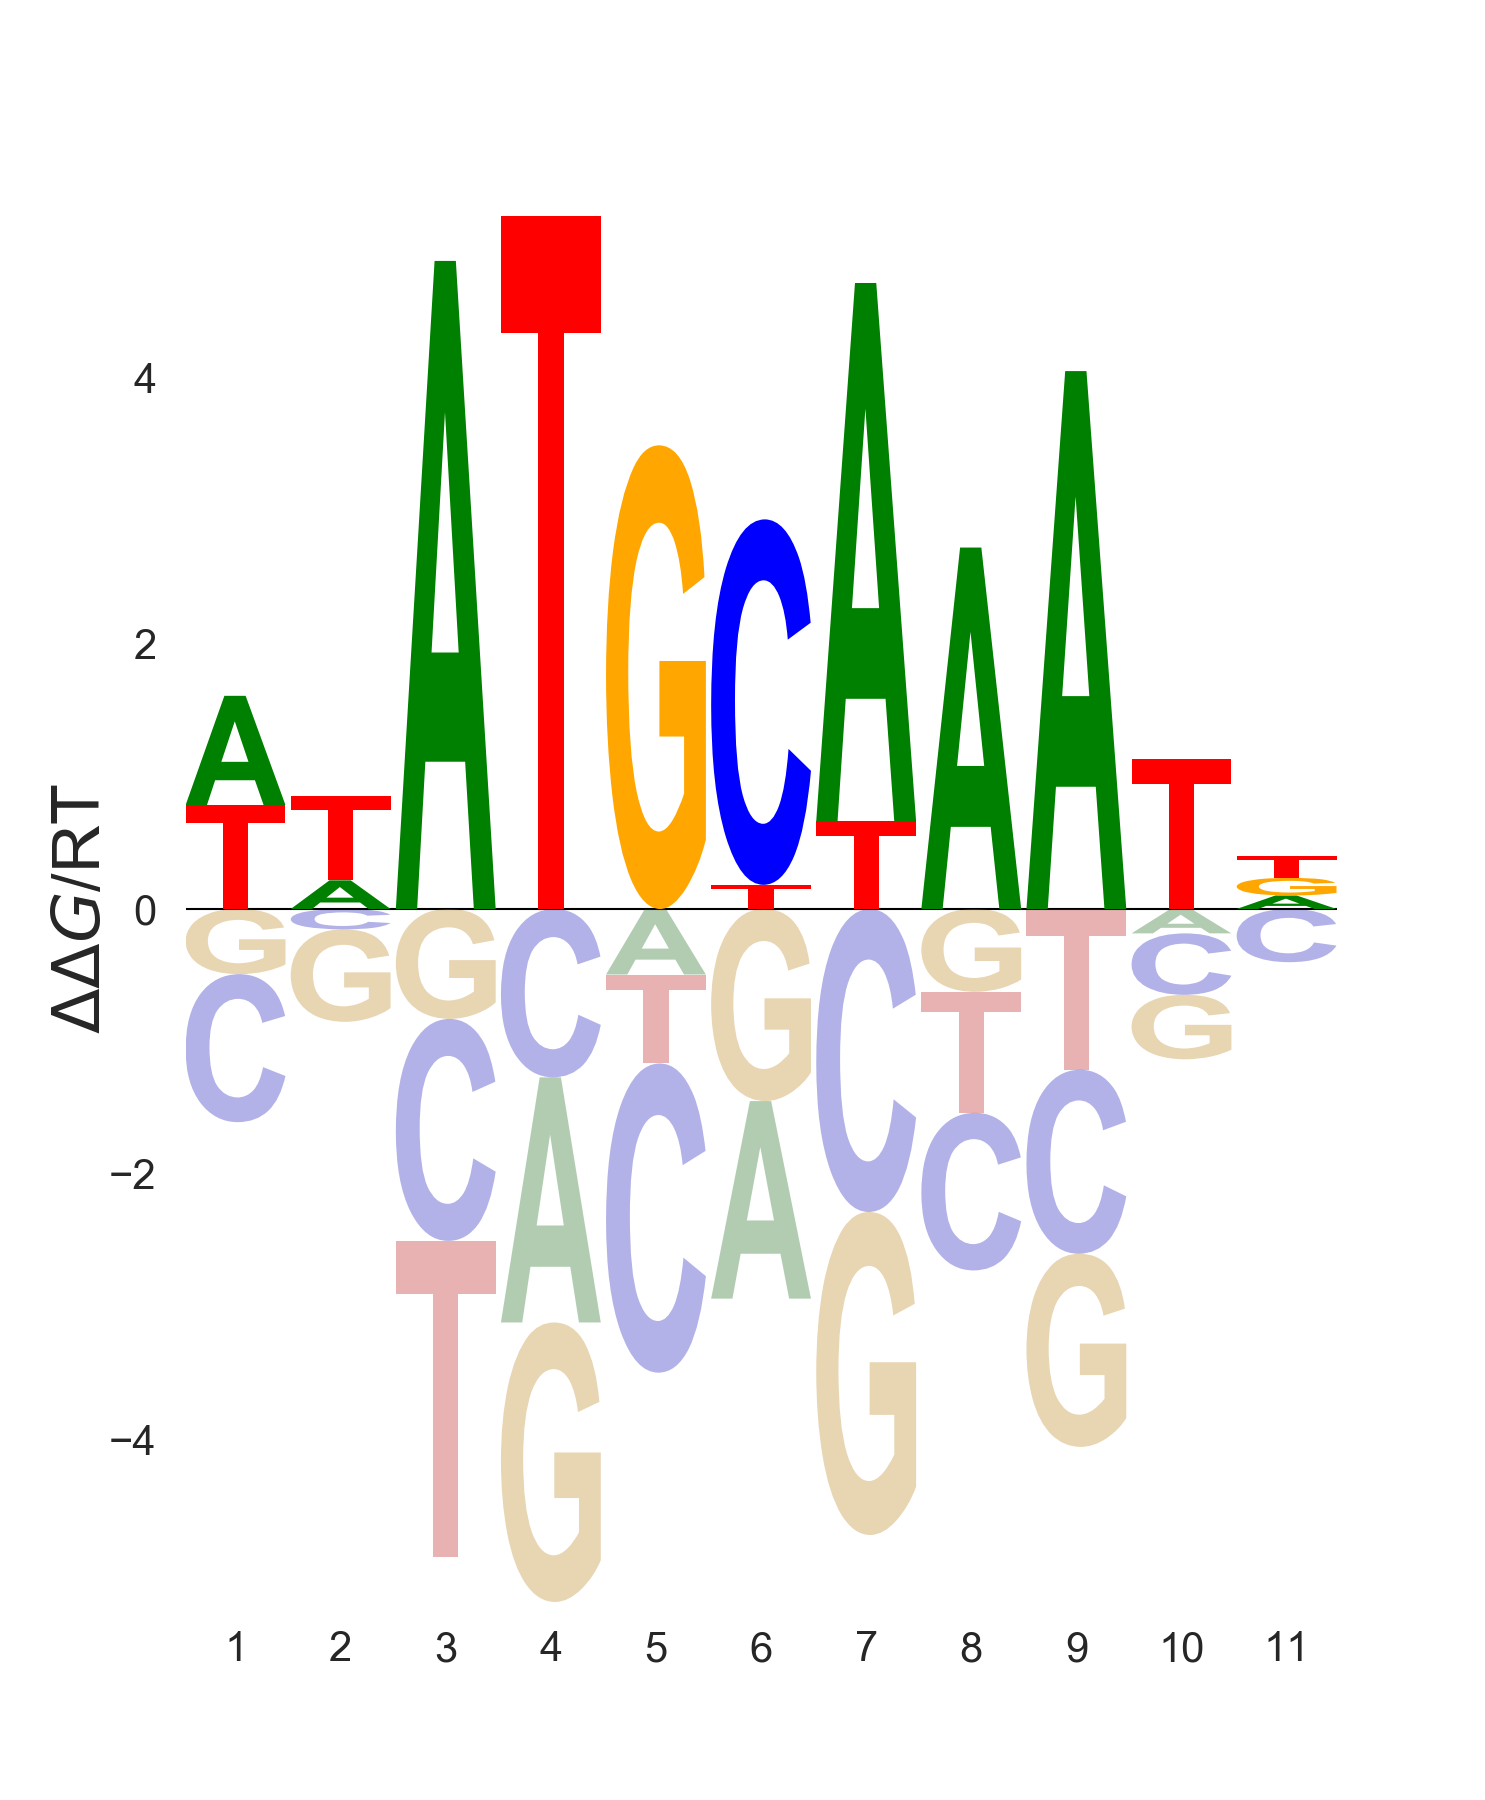
You can specify four types of sequence logos:
information |
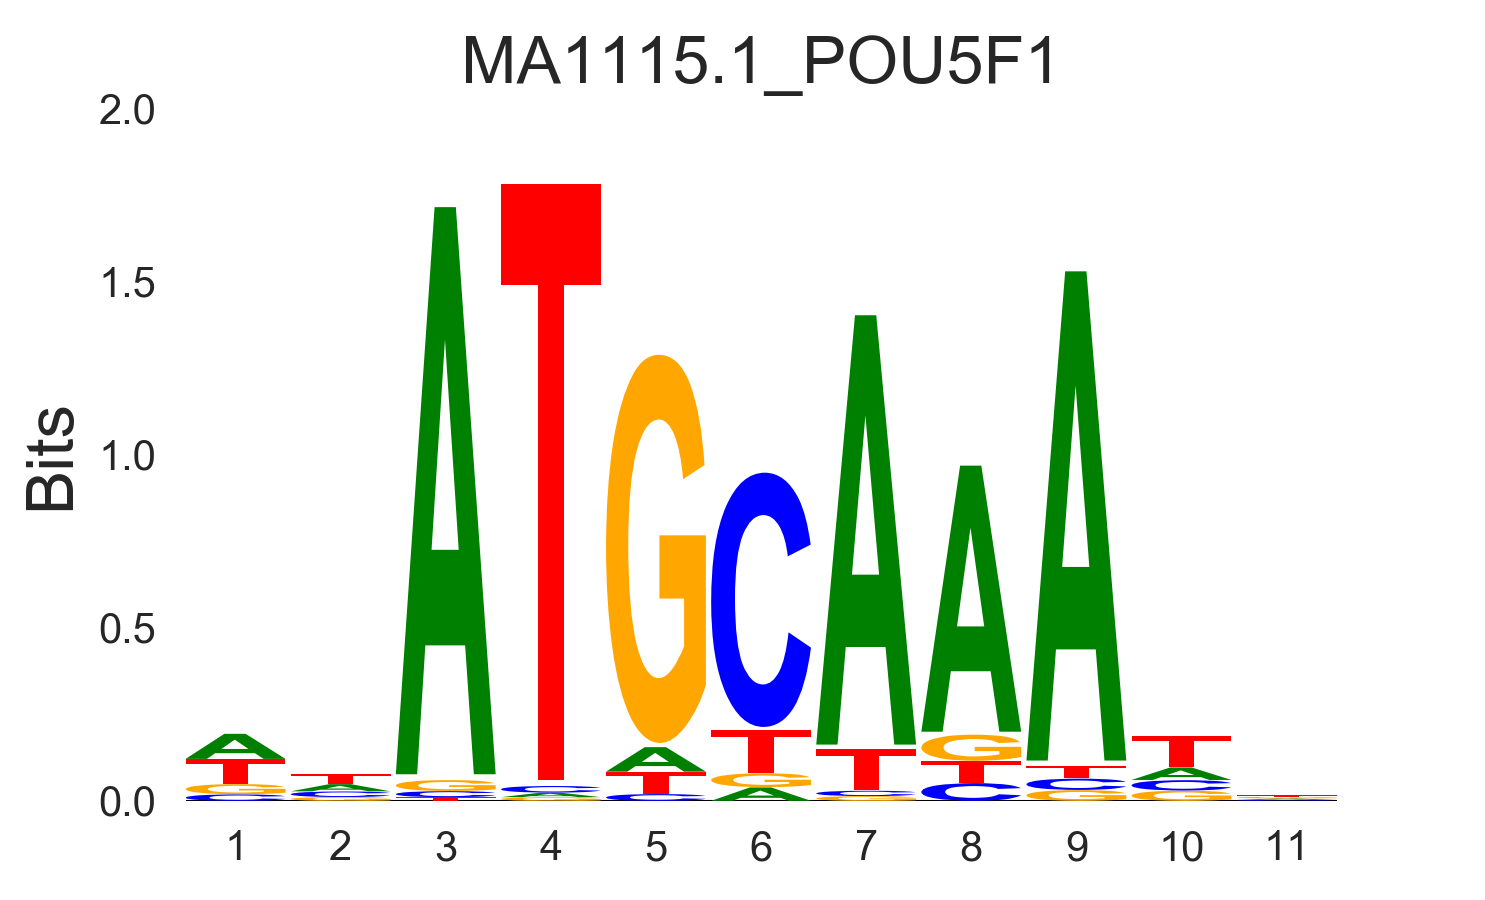
|
frequency |
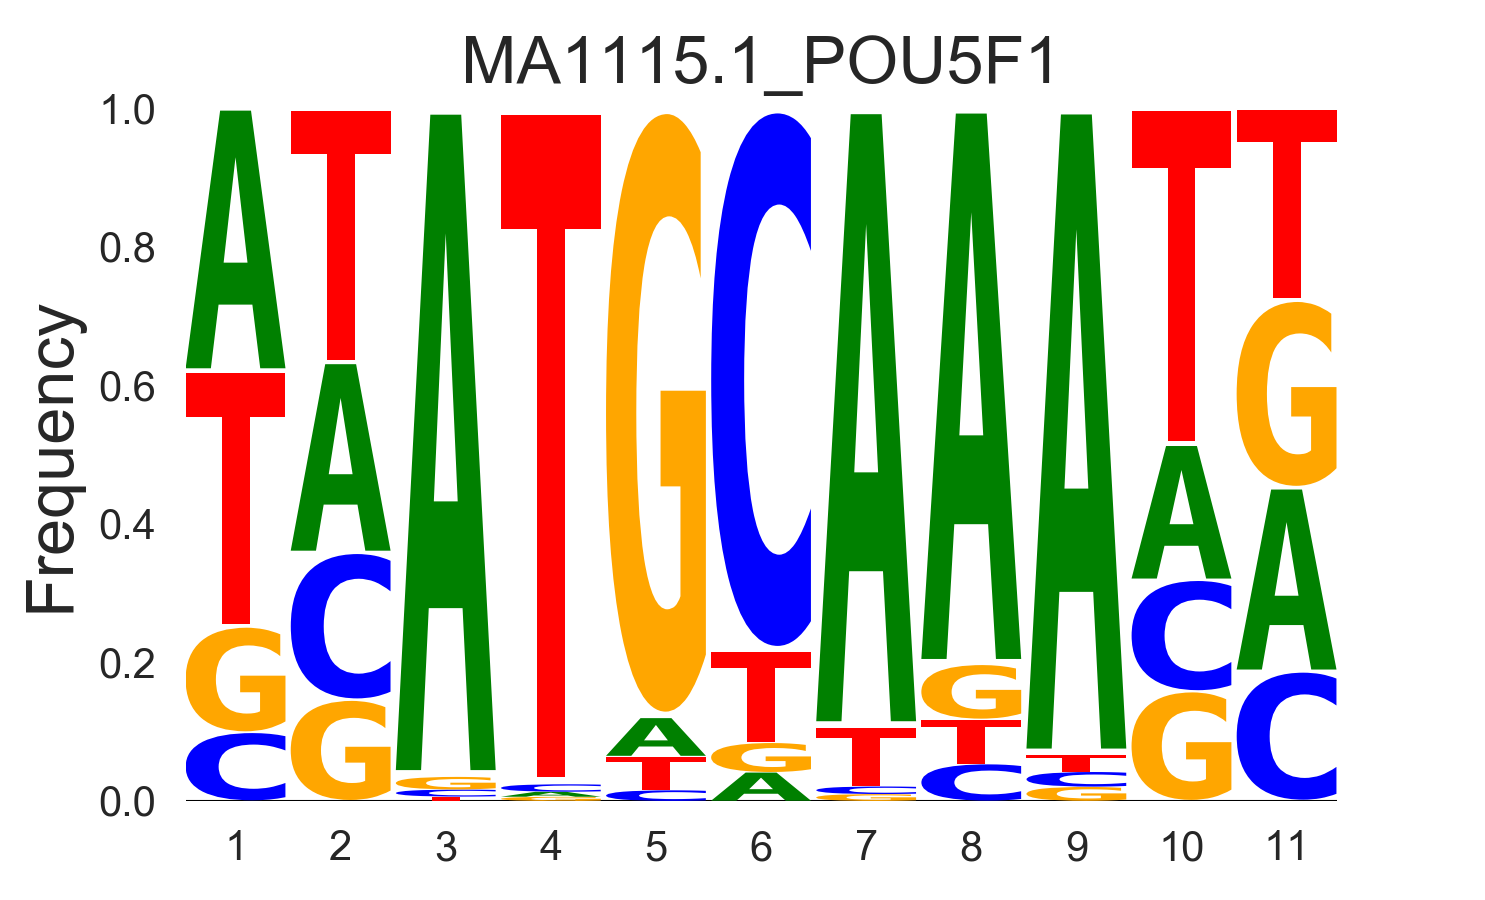
|
energy |

|
ensembl |
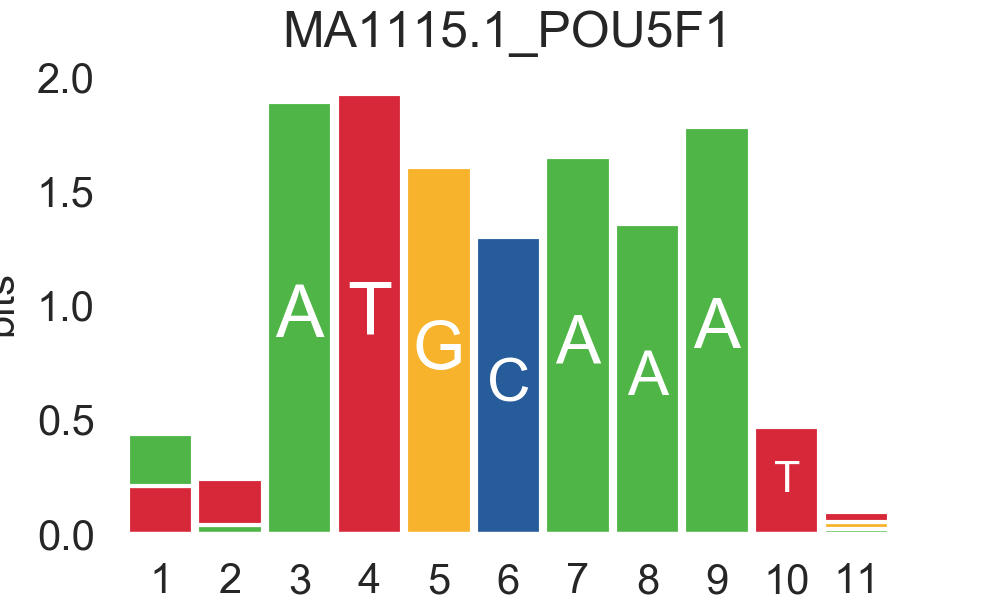
|
You can leave the motif title out with the --notitle argument.
$ gimme logo JASPAR2020_vertebrates -i MA1115.1_POU5F1 -k energy --notitle
Positional arguments:
pfmfilePFM file with motifs. You can use a custom PFM file, or use any of the databases included with GimmeMotifs such as, for instance,
JASPAR2020_vertebrates,HOMER,HOCOCOMOv11_HUMANorCIS-BP.
Optional arguments:
-i IDS,--ids IDSComma-separated list of motif ids (default is all ids).
-k TYPE,--kind TYPEType of motif (information, frequency, energy or ensembl). The default is information.
--notitleDon’t include motif ID as title.
-h,--helpShow help message.
Command: gimme match
Find the the best match of every motif in a PFM file with input motif(s) to a database of reference motifs.
By default the gimme.vertebrate.v5.0 database is used, however, other databases can be
specified using the -d argument. This can be a custom PFM file, or any of the databases
included with GimmeMotifs such as, for instance, JASPAR2020_vertebrates, HOMER, HOCOCOMOv11_HUMAN or CIS-BP.
If an ouput file is specified, a graphical output with aligned motifs will
be created. However, this is slow for many motifs and can consume a lot of memory
(see issue).
It works fine for a few motifs at a time.
Positional arguments:
PFMFILE File with input pfms
Optional arguments:
-h, --help  show this help message and exit
-d DBFILE   File with pfms to match against (default:
            gimme.vertebrate.v5.0.pfm)
-n INT      Number of top matches to report
-o FILE     Output file with graphical report (png, svg, ps, pdf)
Command: gimme cluster
Cluster a set of motifs with the WIC metric.
Positional arguments:
INPUTFILE     Inputfile (PFM format)
OUTDIR        Name of output directory
Optional arguments:
-h, --help    show this help message and exit
-s            Don't compare reverse complements of motifs
-t THRESHOLD  Cluster threshold
Command: gimme threshold
Create a file with motif-specific thresholds based on a specific background file and a specific FPR.
The FPR should be specified as a float between 0.0 and 1.0.
You can use this threshold file with the -c argument of gimme scan.
Note that gimme scan by default determines an FPR based on random genomic background sequences.
You can use this command to create the threshold file explicitly,
or when you want to determine the threshold based on a different type of background.
For instance, this command would create a file with thresholds for the motifs in custom.pwm with a FPR of 1%,
based on the sequences in promoters.fa.
$ gimme threshold custom.pwm 0.05 promoters.fa > custom.threshold.txt
Positional arguments:
PFMFILE     File with pwms
FAFILE      FASTA file with background sequences
FPR         Desired fpr
Command: gimme location
Create the positional preference plots for all the motifs in the input
PWM file. This will give best results if all the sequences in the
FASTA-formatted inputfile have the same length. Keep in mind that this
only makes sense if the sequences are centered around a similar feature
(transcription start site, highest point in a peak, etc.). The default
threshold for motif scanning is 0.95, see gimme scan for more
details.
Positional arguments:
PFMFILE     File with pwms
FAFILE      Fasta formatted file
Optional arguments:
-h, --help  show this help message and exit
-w WIDTH    Set width to W (default: determined from fastafile)
-i IDS      Comma-separated list of motif ids to plot (default is all ids)
-c CUTOFF   Cutoff for motif scanning (default 0.95)
Command: gimme diff
This is a simple command to visualize differential motifs between different data sets.
You are probably better of using gimme maelstrom, however, in some cases this visualization might still be informative.
The input consists of a number of FASTA files, separated by a comma. These are compared to a background file.
The last two arguments are a file with pwms and and output image.
The gimme diff command then produces two heatmaps (enrichment and frequency) of all enriched, differential motifs.
Reported motifs are at least 3 times enriched compared to the background (change with the -e argument) and have a minimum frequency in at least one of the input data sets of 1% (change with the -f argument).
You can specify motif threshold with the -c argument (which can be a file generated with gimme threshold).
For a command like this…
$ gimme diff VEGT_specific.summit.200.fa,XBRA_specific.summit.200.fa,XEOMES_specific.summit.200.fa random.w200.fa gimme_diff_tbox.png -p tbox.pwm -f 0.01 -c threshold.0.01.txt
…the output will look like this (based on ChIP-seq peaks of T-box factors from Gentsch et al. 2013):
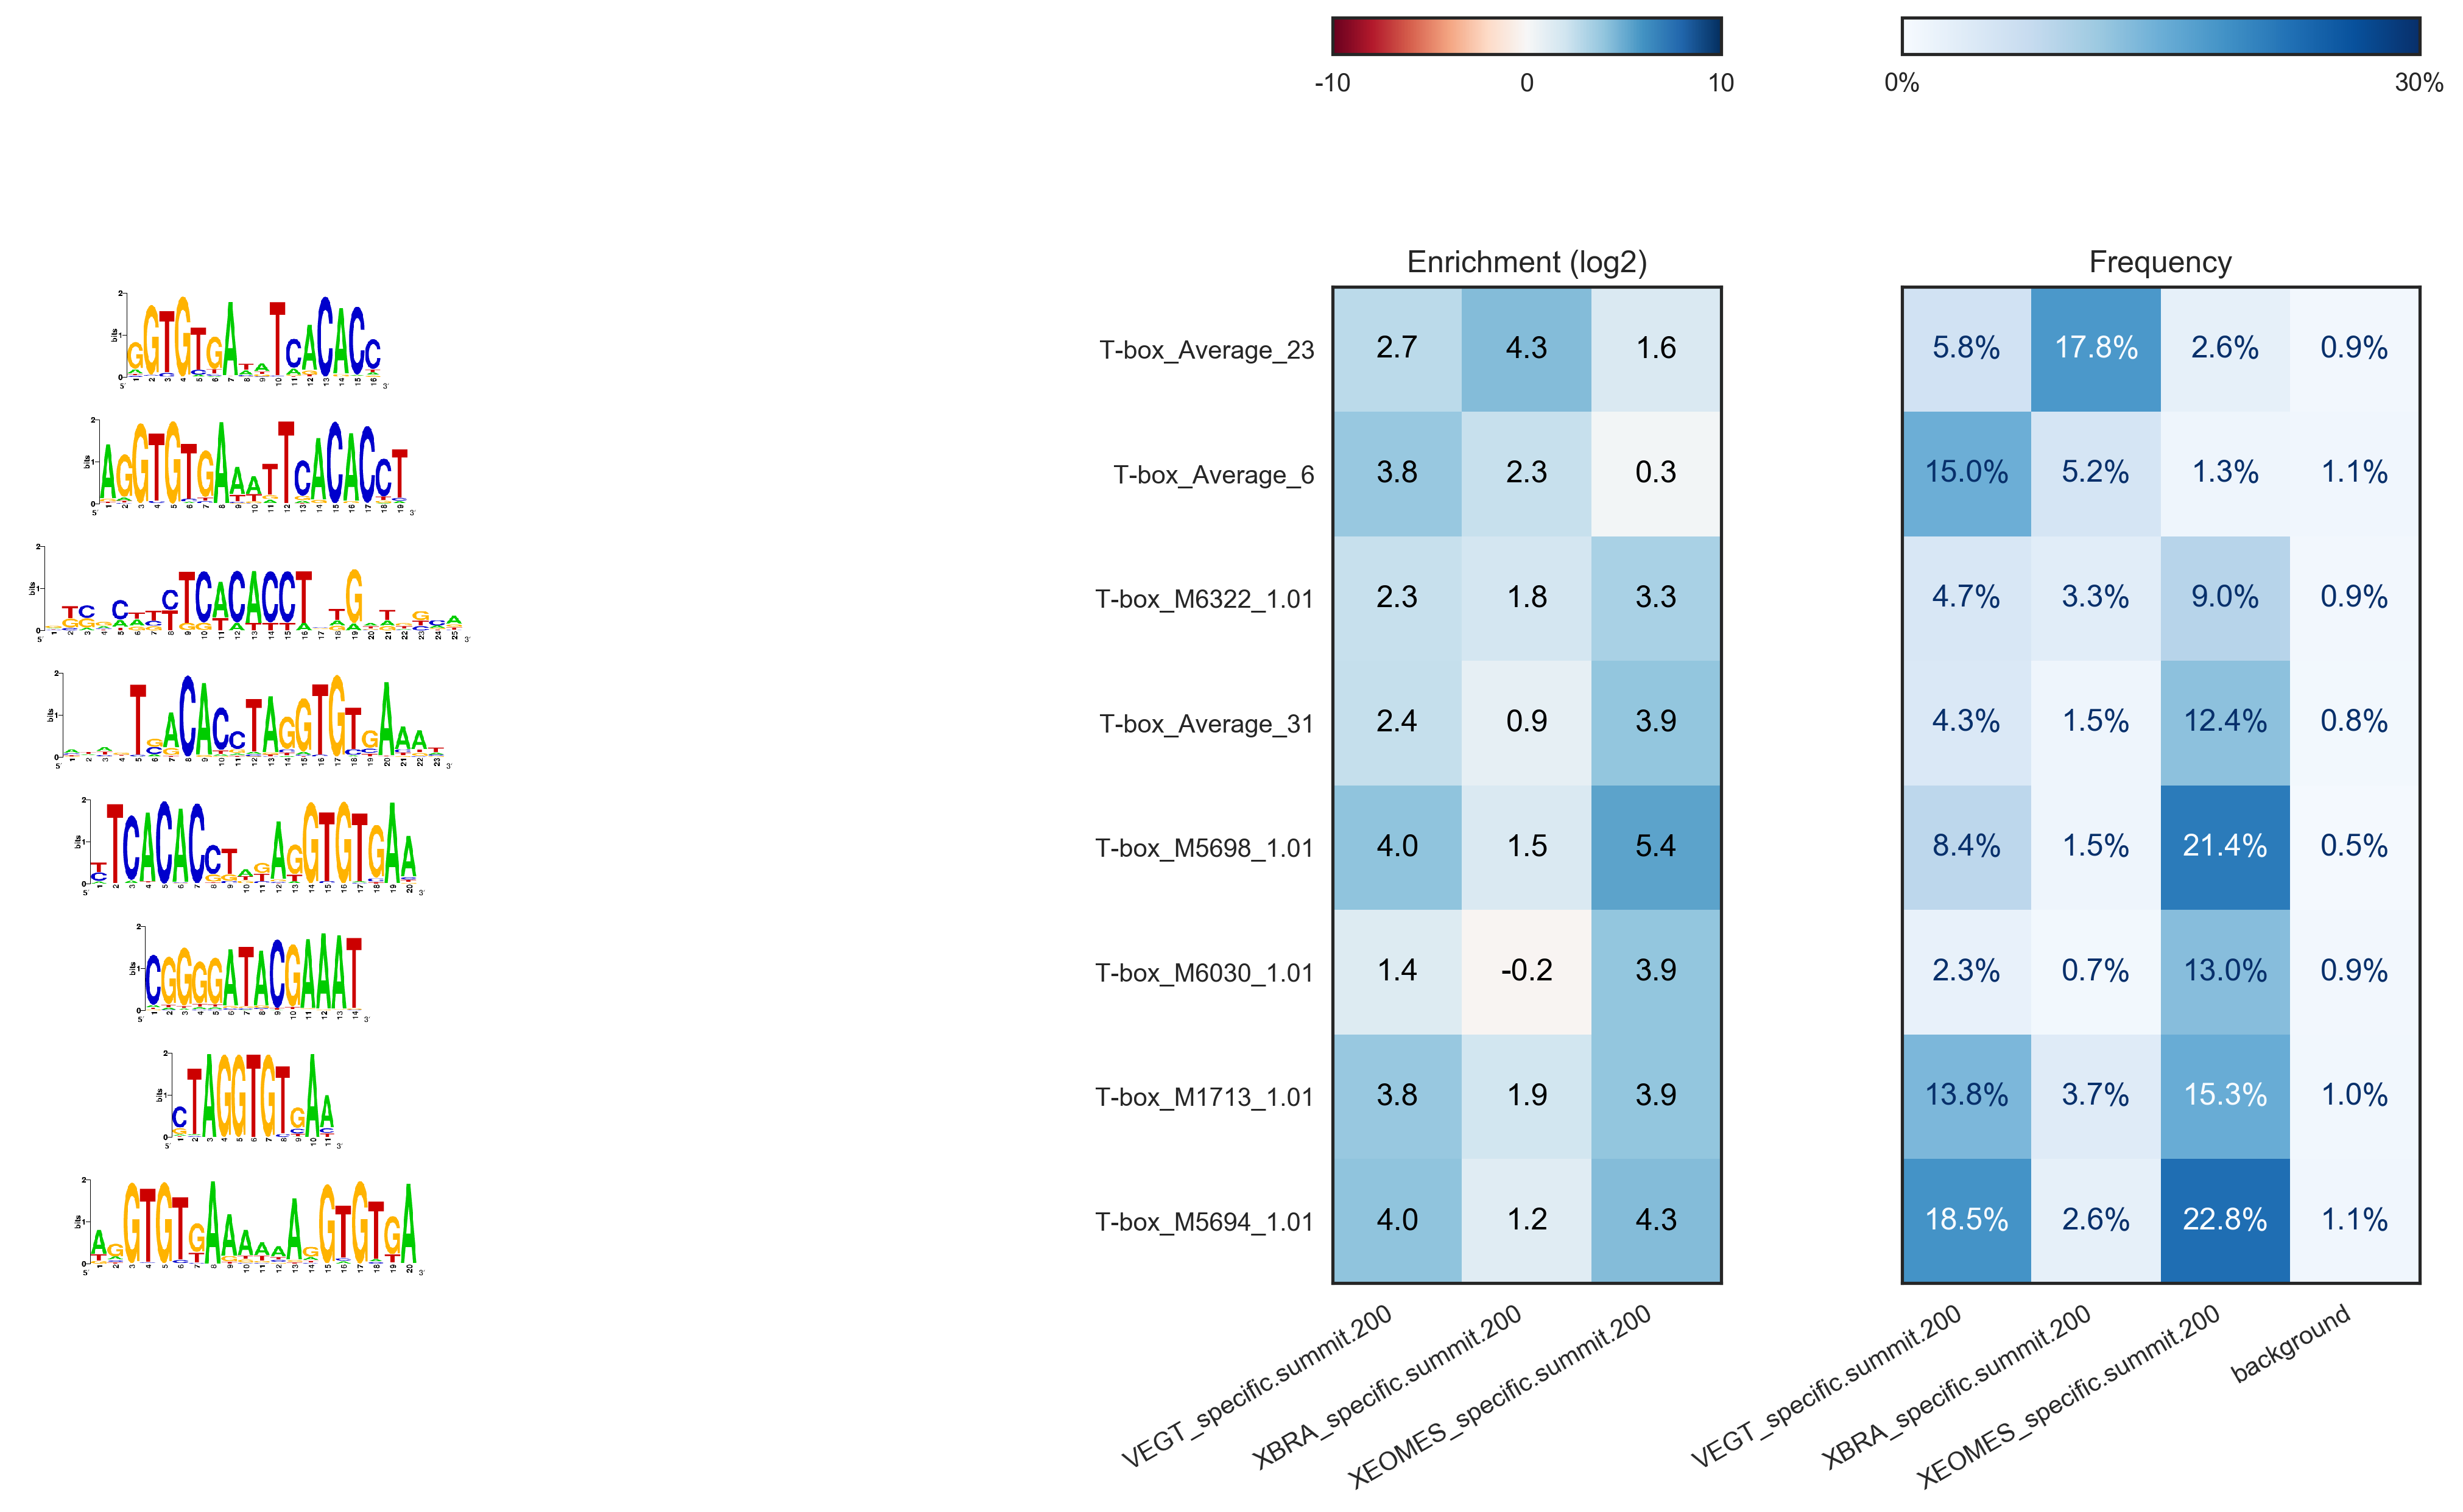
The image layout is not always optimal.
If you want to customize the image, you can either save it as a .svg file, or use the numbers that are printed to stdout.
The columns are in the same order as the image, the row order may be different as these are clustered before plotting.
Note that the results might differ quite a lot depending on the threshold that is chosen! Compare for instance an FPR of 1% vs an FPR of 5%.
Positional arguments:
FAFILES               FASTA-formatted inputfiles OR a BED file with an
                      identifier in the 4th column, for instance a cluster
                      number.
BGFAFILE              FASTA-formatted background file
PNGFILE               outputfile (image)
Optional arguments:
-h, --help            show this help message and exit
-p PFMFILE, --pfmfile PFMFILE
                      PWM file with motifs (default:
                      gimme.vertebrate.v3.1.pwm)
-c , --cutoff         motif score cutoff or file with cutoffs (default 0.9)
-e MINENR, --enrichment MINENR
                      minimum enrichment in at least one of the datasets
                      compared to background
-f MINFREQ, --frequency MINFREQ
                      minimum frequency in at least one of the datasets
-g VERSION, --genome VERSION
                      Genome version. Only necessary in combination with a
                      BED file with clusters as inputfile.
Command: gimme motif2factors
With motif2factors you can convert an existing motif database to a motif database for your species of interest. This conversion is done by orthology, which is not the ideal way to do this. When converting the original database to a database of your favourite critter, only the relations between motifs and transcription factors are changed. A method like this; based on orthology is not capable of inferring whether or not the motif has changed.
However the main advantage of this method is that it is a easy and fast way to get a species-specific database, works surprisingly well, and does not require any special expertise or infrastructure to work.
The method starts by downloading the genome assemblies of your species-of-interest (new-reference), the species the database is based on (database-references), and some other related species for better orthology inference (ortholog-references); by default a selection of vertebrate species. From each of these assemblies, for each gene the longest protein is taken, and compared with orthofinder for orthology:
Then based on orthology, we can replace the names of transcription factors in the original database with the names of our new species.
One problem with this method is that the names of transcription factors in the database not necessarily (necessarily not, bioinformatics…)
have to overlap with the names used in the genome assembly. To overcome this problem mygene.info is queried to still link differently
named TFs can still be linked to genes and thus to orthologs. We tested this for gimme.vertebrate.v5.0, and worked well in our case.
However it might be possible that this generates too many false positives in your case, and you can tweak the lookup on mygene.info
with the --strict/--medium/--lenient flags.
If you happen to work with e.g. a non-public genome or a genome with a different type of annotation, you can supply your own files. This can either be:
a fasta and gtf file with the naming schemes
{genomes_dir}/{genome_name}/{genome_name}.fa{genomes_dir}/{genome_name}/{genome_name}.annotation.gtf
a peptide file with the naming scheme
{genomes_dir}/{genome_name}/{genome_name}.pep.fa
The genome_name can be the name of the assembly/genome you use, e.g. hg38 for human.
The genomes_dir can optionally be specified on the command line.
Otherwise the default genomes dir is used (use genomepy config show to get this location).
If one or more genomes were previously installed with genomepy, their full path can be used as well (regardless of the genomes_dir).
The peptide file should be of the format:
>identifier1
MKNTMKKQSGVVDTFKKAITAKSQWHDKDEFLDVIYWFKQIIGVILGLLWGFIPLKGFLG
>identifier2
MRPLRIIIQRKGKSYGELHGYGQIYKSKMPVSKILLAVNEKRNNHNNISILDDFRRVSSI
where the identifier can be any
1
1|2
3|1|2
and gimmemotifs will use key 1. Usually 1 represents the gene_name, 2 the gene_id, and 3 the transcript_id.
Optional arguments:
--new-reference ASSEMBLY [ASSEMBLY ...]
                      The assembly the new motif2factors file will be based on.
--database db         The database you want to change convert to your species of interest. (default is gimme.vertebrate.v5.0)
--database-references ASSEMBLY [ASSEMBLY ...]
                      The assembly(s) on which the orginal motif2factors is based on. (default is human and mouse)
--ortholog-references ASSEMBLY [ASSEMBLY ...]
                      Extra assemblies for better orthology inference between the new reference and database reference. (default is a range of vertebrate species)
--genomes_dir DIR     Where to find/store genomepy genomes. Defaults to the genomepy config settings.
--tmpdir DIR          Where to place intermediate files. Defaults to system temp.
--outdir OUTDIR       Where to save the results to. Defaults to current working directory.
--strict, --medium, --lenient
                      How strict should the names of the genes in the assembly be followed. Strict: base names only on what is in the annotation file; Medium: base on annotation file, as well as on
                      mygene.info name and symbol query; Lenient: based on annotation file, and mygeneinfo name, symbol, alias, other_names, accession, accession.protein, refseq, refseq.protein,
                      ensembl, ensembl.gene. Lenient is the default, but in case of false-positive hits you can tune this stricter.
--threads INT         Maximum number of parallel threads used.
--keep-intermediate   Keep temporary files, do not delete tmpdir.